About
The addressable market size is a key metric, when evaluating the viability of a business idea. There are a number of ways of coming up with such an estimate. Some are lazy, some are more involved.
This piece is mostly just an exercise in market sizing: a study of the modern business intelligence software market, viewed from a couple of angles.
Introduction
In my view there are roughly three ways of coming up with an estimate for market size, when thinking about new business ventures.
The first one is to pull numbers from thin air, the larger the better. This is the way of the true believers, the inveterate hustlers.
The second way is to rely on analysis done by others. The are many market research outfits out there, and the leading ones have rather interesting relationships with the companies they cover. Two analysts covering the same industry rarely agree — sometimes not even to the same order of magnitude. Definitions vary. At the same time, market evaluation is an exercise in selection and filtering and communicating overall trends. It's not an exact science.
The third way is to do the analysis yourself. This begins by piecing together whatever data you can find on leading industry players, their customers, what they are charging and so on. From these items, it should then be possible to put together some kind of a plausible picture. With publicly listed companies this is easier, as they are required by law to periodically share information in the form standardised reports. Trawling through the documents can still be rather cumbersome.
This piece is about an attempt to piece together the size of the modern business intelligence software market. For further context, I also have a quick look at the accounting software as well.
To stress the obvious: I'm just noodling around here, I don't know what I'm doing. Serious financial analysts do this kind of stuff all day, every day, and they go ten times further. This is just a scratch.
"We need more companies that act like entrepreneurs. The best entrepreneurs don't worry about statistical market projections. They don't care if projections show a $50 million market or a $500 million market. They plan strategy in a qualitative way. They simply take good ideas, develop them into products, then constantly adjust the products to the needs of the market."
VC Approach to Market Sizing
How to get a VC to believe in your market size, by Rob Moffat of Balderton Capital.
Classic methods
- The YCombinator: Huge number, no context
- TAM, SAM, SOM: As above, but with more numbers
- Gartner: Quote the largest analyst number you can find
Jargon
- TAM = Total Addressable Market, the theoretical total product demand
- SAM = Serviceable Available Market, the market you can serve with the business model you have
- SOM = Serviceable Obtainable Market, the market slice that is practical to pursue
By construction, TAM >= SAM >= SOM.
VC Approach
While the methods below can be useful in coming up with a market size, the focus should not be on just ticking the boxes. The point is that having something reasonable to say on these items means that you have "done your homework" on the industry you are planning to enter. Knowing the largest incumbent, for example, is not just about market sizing: it's about understanding the game you'll be playing.
VC Approach to Market Sizing (Moffat)
- Size of largest incumbent: What is the biggest company? Revenue, gross margin, valuation?
- Bottom-up estimate: Current price * #customers in target segment
- Latent demand: Can be much larger than market today (e.g., Uber vs taxis)
- Adjacent markets: Is it credible that you can expand to larger markets?
Market Research Reports
Digital Transformation
Digital transformation (DX) refers to the increasing role that data, networks, and computing play in modern day business. Some industries have already been "digitalised" to a high degree, with the leading companies fully engaged in making the most of all available data. Some industries have moved more slowly, with companies unsure of what value their data-driven operations could bring to their customers.
Market research firm IDC sets Digital Transformation market at $1.3T in 2020, growing at 10.4%. Previously 17.9% growth in 2019. COVID-19 has wiped off almost $500B in worldwide DX investment from their earlier the 2020-2023 forecast ($1.8T vs $2.3T). However, digital transformation remains the topmost strategic priority for organisations in every industry. At the same time the concept is found to be confusing and intricate. DX is expected to represent the majority share of total worldwide ICT investment in 2021.1 2
Markets and Markets place the DX market at $470B in 2020, growing to $1T by 2025 at 16.5% during the forecast period. Major growth drivers of the digital transformation market are the increasing penetration of mobile devices and app and the increasing adoption of cloud services.3
Comparing the IDC and MnM estimates, it's easy to see why market sizing is tricky: the two market size estimates differ by a trillion dollars.
Big Data
Big Data is the fuel to the digital transformation fire. Big Data is characterised by high data volumes, high data variety, increased "velocity" (in generation and processing), critical veracity (or data accuracy and reliability), etc.
IDC puts the Big Data Analytics market at $200B in 2019, growing at 12.0%; $275B in 2022.4 End-user query, reporting, and analytics tools at $13.6B of overall $67B software segment. IDC claim that cloud/on-premise investment split reached 50/50 parity in 2021, a significant milestone for the industry.
ABI research sets the Big Data market at $31B in 2013, growing at 30% to $114B in 2018.5
Markets and Markets has Big Data grow from $140B in 2020 to $230B by 2025, CAGR 10.6%. Big data analytics segment to grow at higher CAGR.6
Business intelligence toolmaker Yellowfin with some historic perspective7:
-
IDC: Global software at $342B in 2012, growing at only 3.6% — less than half of 2010 and 2011.
-
Wikibon: Big Data at $11.4B in 2012, growing to $18.1B in 2013 at incredible 61%. $47B by 2017 at 31%.
ABI - Big Data Spending to Reach $114 Billion in 2018; Look for Machine Learning to Drive Analytics
Business Intelligence / Business Analytics
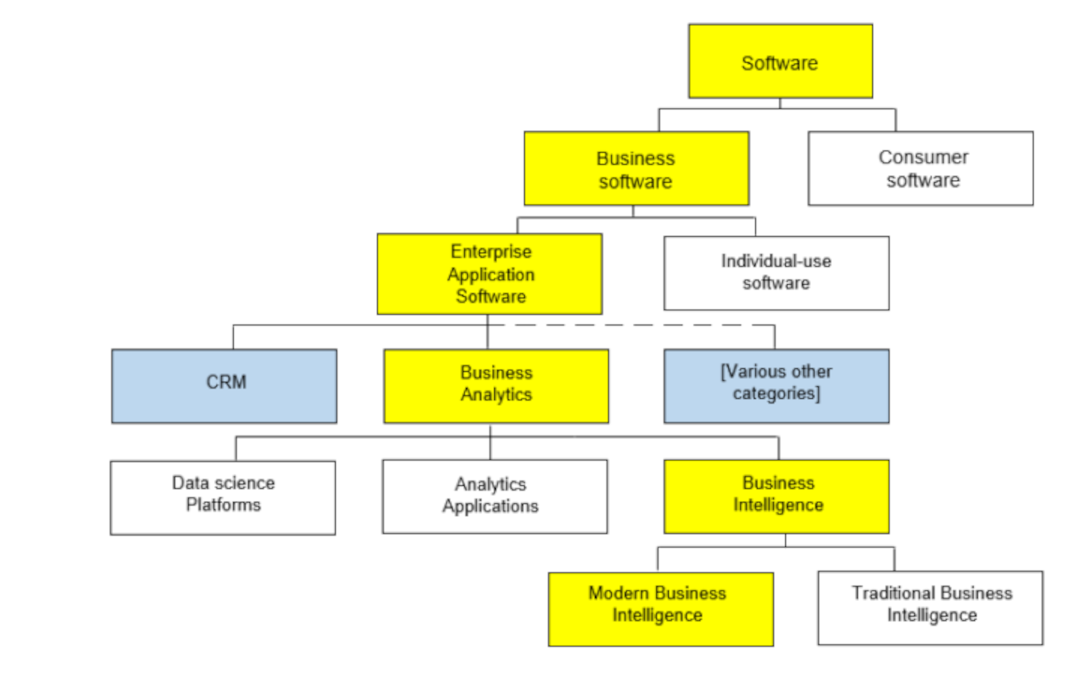
Business software classification is a challenging endeavour. Despite already a few decades of history, the terminology hasn't really settled down. Business intelligence and business analytics are at least closely related if not the same thing. Business intelligence software aims to assist businesses in turning data into insights and insight into action. If digital transformation is the fire, to continue the tenuous metaphor, business intelligence is perhaps the campfire story or the marshmallow toasting practice.
The business intelligence industry can be sliced and diced in a number of ways by focusing on differentiating features. For example, some tools are more focused on predictive analytics. Some tools feature "augmented analytics", where advanced computing techniques are used to surface insights with minimal user involvement. One key division within the industry is to on-premise solutions on one hand and cloud-based "modern" solutions on the other.
Business intelligence is our main focus, so we draw broadly on available market research.
Market and Markets
Global Business Intelligence and Analytics Software Market at $17.9B in 2015, growing to $26.8B by 2020, at 8.4%.8
Global Predictive Analytics market at $7.2B in 2020, growing to $21.5B by 2025, at 24.5% during the forecast period.9
Global Business Intelligence market at $23.1B in 2020, growing to $33.3B by 2025, at 7.6% during the forecast period. Various factors such as the growing focus on digital transformation, rising investments in analytics, rising demand for dashboards for data visualisation, increase in adoption of cloud, and increase in data generation are expected to drive the growth of the business intelligence market.10
Valuates
Global Cloud Business Analytics Market in 2020 to grow to $48B by 2025, at 20%. 11
Global Big Data and Business Analytics market at $171B in 2018, growing to $512B by 2026 at 14.8% from 2019 to 2026. 12
Global Big Data and Business Analytics market at $193B in early 2019, growing to $421B by 2027 at 10.9% from 2020 to 2027.13
Global Big Data and Business Analytics market at $192B in late 2019, growing to $446B by 2025 at 15.07%.14
Statista
Global Big Data and Business Analytics at $169B in 2018, growing to $274B by 2022 at 13.2%. Business intelligence and analytics software application market is forecast to reach around $14.5B in 2022.15
Global BI & Analytics Software market at $14.9B in 2019, growing to $17.6B in 2023 at mere 4.3% per annum.16
BI analytics is a segment of the enterprise application software market. Enterprise application software was at $210B in 2019. Business intelligence applications are used to collect and analyse current, actionable data in order to maintain, optimise or streamline business operations. Business analytics tools are used to analyse data to be able to predict business trends. The leading companies in the business intelligence and analytics market are Microsoft, SAP and IBM, with (BIA) revenues of $2.6B, $2.1B, and $1.9B respectively in 2018.16
Forrester
Business intelligence market will grow from $9B (Gartner) in 2009 to $14B by 2014 (at 9%) driven by advanced analytics.17
Business intelligence software is the tip of the application software pyramid. Pure functionality, no matter how sophisticated, is no longer sufficient to successfully support the changing business requirements of today. New categories of advanced analytics will fuel the growth and merge into the core BI market, including business performance solutions, text analytics, predictive analytics, and complex event processing. Each of these market sectors will grow at its own pace and will converge over time into core BI as new sectors emerge.17
In 2019, Forrester projects BI to be a $22 billion market growing at 9.3% year over year, "with no end in sight". There is significant divergence in the maturity of the supply and demand sides of the market. This will influence market dynamics in the coming years.
-
Supply side is very mature. BI technology has been around for at least 30 years, and it continues to grow and thrive.
-
Most features, such as database connectivity and data ingestion, security, data visualisation, and slice-and-dice OLAP capabilities, have become table stakes. Forrester no longer evaluates all features of BI platforms but only what they consider differentiated capabilities.
-
Increased technology maturity and decreasing differentiation between BI platforms are driving the latest round of M&A in this market.
-
Demand side — organisations procuring and deploying BI solutions — is still quite immature. BI technology only addresses part of the success equation; the other components, such as people, process, and data, remain quite challenging to master. The low maturity of the people/process/data components will ensure that the BI technology market is healthy and vibrant for the foreseeable future.18
"Mature supply, immature demand." I can't help but think that the industry is not listening to the customer. How can the supply side be mature if people are not getting the value they out of the available solutions? In any case it seems clear that the market is not going away.
Gartner
BI Analytics market at $9.3B in 2009, growing to $14.4B in 2014, 8.2% CAGR. BI Platforms make up biggest chunk with $6B in 2009, growing to $8.8B by 2014. BI Apps from $1.4B in 2009 to $2.4B in 2014. Rest is CPM Suites. 19
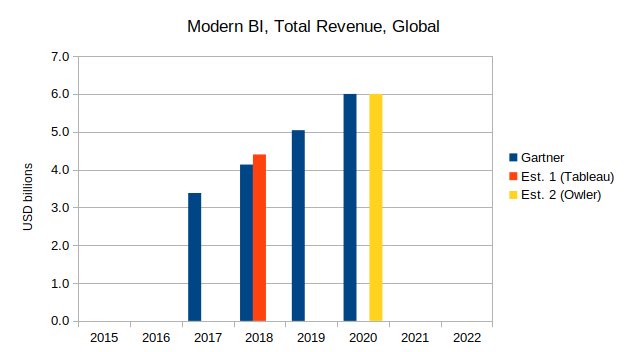
Modern BI platform market grew by 19% in 2019, compared with 22% in 2018, to reach just over $6 billion.20
Analytics and business intelligence software market grew by 11.7% to $21.6 billion in 2018. Modern BI platforms continue to be the fastest growing segment at 22.3%, followed by data science platforms with 19.0% growth.21
According to Gartner’s market share analysis, analytics and business intelligence market revenue grew by 22.3% in 2018, compared with 35.0% in 2017.22
Others
PC Mag (quoting IDC): Global Big Data and Business Analytics at $122B in 2015, $149B in 2017, $169B in 2018, and estimated at $189B 2019. IDC projects revenue will shoot up dramatically to $274 billion by 2022. Salesforce's Tableau acquisition and Google buying Looker are just the latest examples of the lucrative power of data in every facet of business operations and across the digital landscape. In this lucrative market, it's no surprise that standalone business intelligence (BI) and data visualisation platforms are being acquired and rolled into bigger tech companies.23
ResearchAndMarkets: Global BI software market at $14.3B in 2018, growing to $28.8B at 19.1% through 2022. According to IDC, in 2018, 50% of the IT infra spending is on cloud based tools and for efficient data storage. This is expected to grow to 60-70% by 2020.24
Gartner - Magic Quadrant for ABI Platforms (pdf) (see also Gartner BI Market Share analysis 2019)
AI, ML, Data Science
Applied data science, machine learning, artificial intelligence, etc., are newer entrants in mainstream business software world, but in this context can be thought of as sub-fields within business intelligence.
ABI: IoT ML and AI at $1B in 2020, growing to $10B in 2026 at 46.8%.25
ABI: Edge AI inference will grow from just 6% in 2017 to 43% in 2023. 2.2 billion of the 3 billion AI device shipments will rely on cloud service for AI training.26
Gartner: Data Science and Machine Learning platforms grew by 17.5% in 2019 (down from 24.3% in 2018) to represent the second-fastest-growing segment of the analytics and BI software market (behind modern BI platforms at 17.9%). DSML segment revenue for 2019 was $4 billion (up from $3.4 billion in 2018). Its share of the overall analytics and BI market grew from 15.1% in 2018 to 16.1% in 2019. Several of the smaller and younger vendors in this market are sustaining hyper-growth. Growing at the rate of the market is actually to grow slowly, compared with the growth rates of many vendors in this Magic Quadrant.27
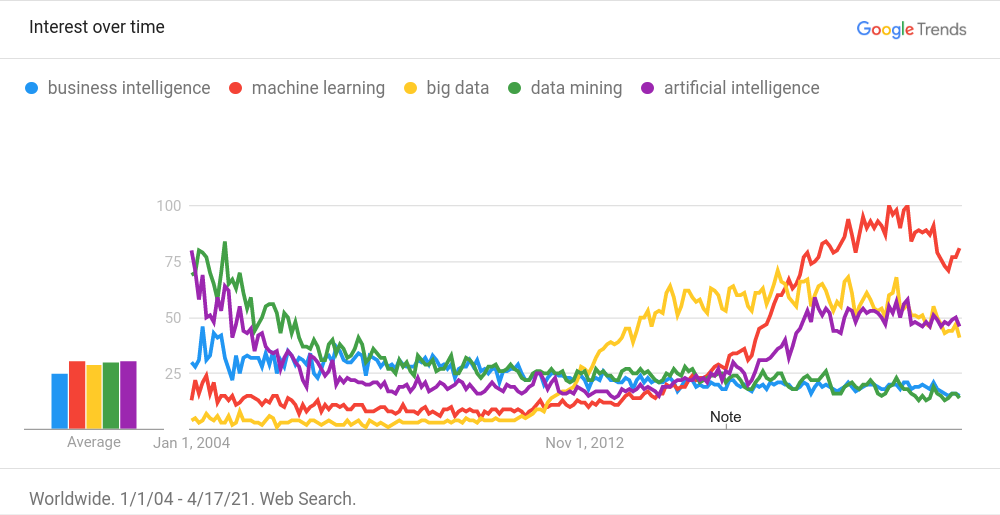
Google Trends was mentioned in one of the reports. Here's one for some hype terms:
Bottom-up Market Sizing
Here we try to do the market size analysis ourselves. We take some public market share data and combine it with public filings from listed companies to estimate the total (segment) revenue of companies involved in the industry.
UK Gov on Salesforce/Table merger
In 2019, when Salesforce bought Tableau, the UK Gov Competition and Markets Authority (CMA) assessed the landscape, quoting from market research and giving their own estimates for worldwide revenue.
The decision (pdf) is an interesting read in its entirety.
"The European Commission has defined BI tools as query, reporting and analysis tools on the one hand and advanced analytics on the other. These tools allow data mining, ad hoc query capabilities, reporting functions, scorecards and modelling. In this regard, third party market reports have further segmented BI software into Traditional BI (i.e., BI products centred on reporting functions, such as Microsoft Excel) and Modern BI."
The decision quotes BI platform market share estimates made by the companies, but the actual figures have been redacted from the published document:
"One internal document predicts that the market share of Traditional BI platforms will decline from X% in 2016 to Y% in 2021, whereas the market share for Modern BI platforms will increase from A% in 2016 to B% in 2021."
However, later on CMA provides their own market share estimates (worldwide revenue) for 2018, based on IDC and Gartner estimates and Tableau/Salesforce internal documents.
| Company | Market Share |
|---|---|
| Salesforce.com | [0-5]% |
| Tableau Software | [20-30]% |
| Microsoft | [5-10]% |
| SAP | [5-10]% |
| Oracle | [5-10]% |
| IBM | [10-20]% |
| Qlik | [10-20]% |
| SAS | [0-5]% |
| MicroStrategy | [0-5]% |
| Information Builders | [0-5]% |
| TIBCO | [0-5]% |
| DOMO | [0-5]% |
| Looker | [0-5]% |
| Other Companies | [10-20]% |
The CMA also determines that Salesforce is a market leader in CRM software:
"Salesforce’s products account for around [20-30]% of global revenues for CRM software."
The final decision clears the acquisition:
"Decision: The CMA does not believe that it is or may be the case that the Merger has resulted, or may be expected to result, in an SLC (substantial lessening of competition) within a market or markets in the United Kingdom."
SEC Filings
Prior to the 2019 acquisition, Tableau was a publicly listed company and therefore regularly filed with the US Securities and Exchange Commission, SEC. The 10-K form, the annual report, paints a picture of the company and the wider market. Tableau was founded in 2003 and went public in 2013. Salesforce bought Tableau in 2019 for $15.7B.
Tableau's final standalone 10-K, for fiscal year ending Dec 31, 2018, is available in the EDGAR database. Tableau seemed to have been in the process of switching reporting schemes, so it reads even heavier than usual, but it's still easy to see how well the company was doing.
Tableau reports revenues split in two: Licence, and Maintenance and Services. Combined, Tableau posted a total revenue of $1.16B for 2018, up from $0.88B in 2017, $0.83B in 2016, $0.65B in 2015 and $0.41B in 2014. This corresponds to annual growths of 31.7%, 6.1%, 26.5%, 58.4%, respectively, or 29.3% CAGR for the four years.
If we assume $100K revenue in 2003, CAGR up to 2014 would be 113%. In other words, on average, Tableau revenue more than doubled in size every year for a decade.
According to the filing, Tableau's cost of revenue has been low and fairly steady. Indeed, a gross profit of $1.01B on a total revenue of $1.15B gives a gross profit margin of around 90% for 2018. With operating expenses at $1.1B, Tableau was almost profitable in 2018, posting a net loss of $77M.
Market Sizing
If we take the $1.1B revenue number for 2018 and combine it with the UK Gov estimate of ~25% market share, this gives a total market size for Modern BI at $4.4B. This is nicely in agreement with Gartner research that suggests a market size of around $6B for 2020, and around 20% growth for the last three years — or $4.1B for 2018.
More Estimates
Owler is a company data crowd-sourcing service. Among other details, the site gives estimates for company revenues.
Looking at the latest available Owler data, Tableau has a revenue of £1.3B, which sounds reasonable compared to above. Of the newer players we have Looker at $140M, Domo at $210M, Sisense at $90M, and GoodData at $60M. From the older guard, we have TIBCO at $1.6B, Qlik at $610M, Alteryx at $500M, MicroStrategy at $480M, and Board at $80M.
A quick glance at Crunchbase informs us that SAP, MicroStrategy, Domo, and Alteryx are public companies.
Searching for more EDGAR filings, we find that:
- MicroStrategy posted $481M in revenue for 2020, with a 80% gross margin, and a $13M loss; the business shrank by 1% compared to 2019
- DOMO posted $210M in revenue for 2020, with a 73% gross margin, and a $84M loss; the business grew by 20% compared to 2019; Domo has over 2000 customers as of January 31, 2021, up from 1800 the year before.
- Alteryx posted $500M revenue for 2020, with a 90% gross margin, and a $24M loss; the business grew by 18.5% compared to 2019; number of customers grew from 4,973 at March 31, 2019 to 7,083 at December 31, 2020; roughly 100 new customers per month
- SAP, being a German company, posted a 20-F instead; as it happens, piecing out the business intelligence revenue from the group statements is a bit too involved for this exercise
Three for three on the analytics revenues, so Owler's data is probably useful. Though, of course, getting the public companies right is relatively easy.
Adding known Owler revenues together sums to about $5B, which with a 15% "others" provision gives a market size of around $6B for modern BI. Again, nicely aligned with the Gartner estimate.
If Domo has 2000 customers at $210M revenue and Alteryx 7100 at $500M revenue, I think we can say that the average customer is worth about $75K-$100K. This sounds high, but at the same the way these companies calculate customers varies. We are obviously talking about customer organisations, rather than individual users. If Domo is 210/6000, or 3.5%, of the total Modern BI market, we are talking about at total market of over 50,000 organisation customers.
Related markets
A quick look a accounting software, which in some ways has a similar user profile to business intelligence software. The customer, however, seems to be a slightly different entity. Where business intelligence customers are apparently larger organisations, accounting with a side of payroll is something every small business requires. Thousands of customers versus millions of subscribers.
Small and medium-sized businesses are more likely to use cloud-based accounting platforms, which probably lines up nicely with the modern business intelligence software market.
Accounting software
A recent Fortune Business Insights report puts the global accounting software market at $11B in 2018, growing at 8% CAGR to $20.4B in 2026. The main players in this market are in a sense regional powers, with different brands dominating in different parts of the world. Some of the main specialist players are Intuit Quickbooks, Sage, and Xero, while a chunk of the market goes to software giants such as Oracle (NetSuite), Microsoft, and SAP.
Mordor Intelligence puts the accounting software market at $12B in 2020, growing to $20B by 2026 at 8.5% over the 2021—2026 period. The market is very much in the middle of an on-premise to cloud transition, and ranked as being fairly concentrated. Oracle, Microsoft, SAP SE, Xero, and Intuit (Quickbooks) dominate.
Total Accounting throws out that Quickbooks has 80% of the small business market.
Datanyze gives Quickbooks roughly two thirds of the market, with Xero at 5%.
Enlyft claims Quickbooks has 75% of the market, with Xero at 5% and Sage at 7%.
Xero
Xero is a cloud-based accounting software platform for small and medium-sized businesses. As a publicly listed company in Australia, we can get their filings from the local exchange. We can also pull the annual reports directly from Xero's investor relations page. Some pickings from the latest one, for 2020:
- Total revenue went from A$550M in 2019 to A$720M in 2020; gross margin at 85%.
- 2020 delivered Xero's first ever profit, at A$3M.
- Xero was founded in 2006, in New Zealand; went public in 2012
According to their website, Xero have over 2 million subscribers. That's an average revenue per customer at A$360, or A$30 per month. A look at the plans at Australian Xero site gives three categories: Starter at A$13.50, Standard at A$26, and Premium from A$33.50 for five people payroll, and roughly an extra A$2 per month per payroll person beyond 100. In other words, the average plan lines up nicely with the A$30 per month revenue-derived plan.
1 AUD is about 0.75 USD, so A$720M is about $560M. If the whole accounting market is something like $13B in 2020, Xero is about 4% of it. This lines up OK with the 5% estimates.
"Life before Xero was a nightmare. I was basically using an Excel spreadsheet set up by a friend. The amount of time it took was ridiculous."
Intuit
Intuit, founded in 1983, is a public company listed on the NASDAQ. Accordingly, we can pull the latest Intuit annual 10-K report from EDGAR. Intuit have multiple software products, the accounting solution (family) Quickbooks being the one we are interested in here.
Intuit gives per-segment operation results, where Quickbooks lies under the "Small Business & Self-Employed" bucket. Revenue for the segment is given as $4B in 2020, up from $3.5B in 2019. This represents about half of the group's total revenue.
Intuit claim to be serving more than 50 million customers, though on a banner on their website they declare that "only" 4.5 million businesses are using Quickbooks. So customers and businesses might be counted differently. In any case, revenue per customer for Inuit overall would be something like $7.7B / 50 million customers, or roughly $150. For Quickbooks, $4B per 4.5 million businesses comes out to almost $900, or $75 per month. This would mean the "Advanced" Quickbooks plan at exactly $75/mo, or the "Plus" plan at $35/mo with payroll plugins included. Again, seems to fit quite nicely.
Intuit's $4B is roughly seven-fold Xero's $560M. If Xero has 5% of the market, Inuit should have just 35%. It's not clear how the 75% market share was calculated. Of course, just comparing group revenues, $7.7B and $560M gives Intuit 13.75 times the market share, or roughly two thirds. This feels like an apples to oranges comparison, but it does line up better with the 60-80% claims in the articles above.
Conclusion
Bringing together the market research reports and our own analysis, we can draw up some charts.
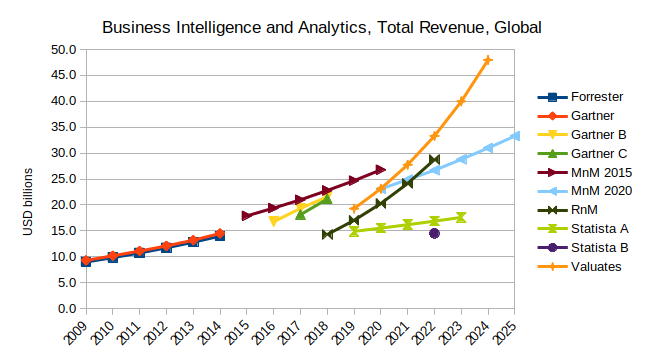
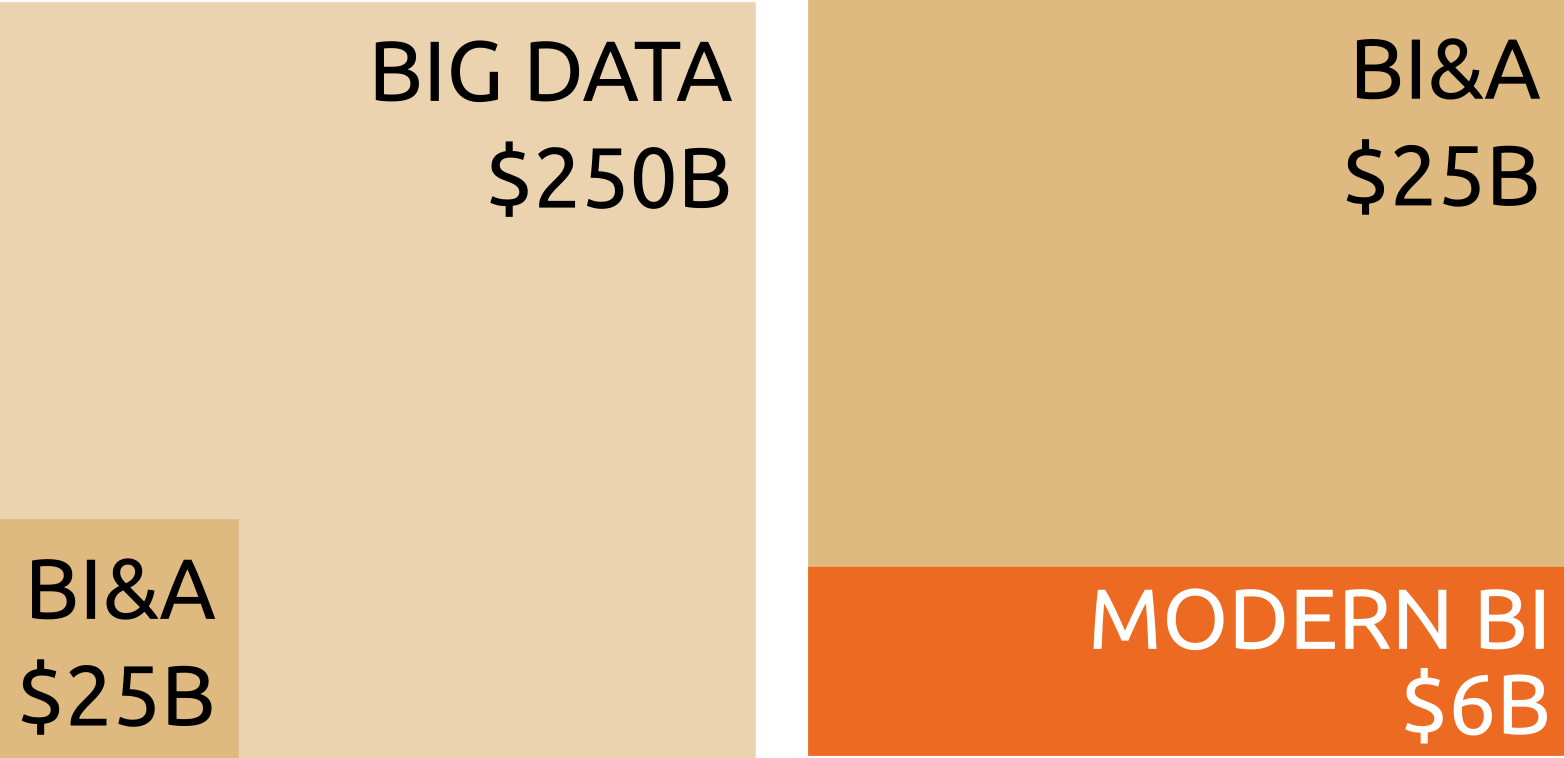
First, we can see that the overall business intelligence market is probably around $25B or so today:
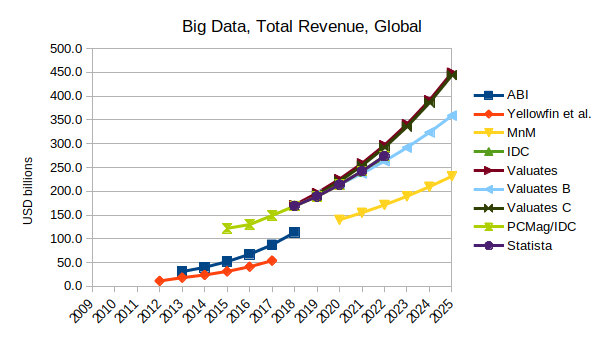
Second, we can see that the Big Data market is probably around $250B or so. In other words, BI represents about a tenth of the Big Data market. We can then speculate that Big Data is about half the total business software market, ~$500B. The overall software market is then in the trillions, depending on your definitions. $2.5T would be a nice 10x number based on the Big Data figure. At this scale it's more about order of magnitude. Total market cap of all companies, globally, is well in the tens of trillions.
Focusing on our target market again, modern business intelligence, we can see how our estimates look with the published research. Modern BI, growing about twice as fast as the business intelligence market as a whole, and already makes up about a quarter of the whole.
Finally, we can pull all of this together with a simple proportional area chart that shows modern BI in context.
